Environmental issues can be overwhelming and confusing which is why organizations seeking better communication tools to persuade, change and challenge constituents turn to Funnel Incorporated for information design, infographics and icons. One well-executed infographic or icon can be used for fundraising, presentations, media outreach, online, annual reports, events and more making this investment cost effective as well.
"Transparent organizations seeking to avoid the green washing backlash are wise to eschew superficial claims, window dressing and data manipulation," says Lin Wilson, Creative Director of Funnel Incorporated. “We advise clients to stick to the facts and respect its audience by presenting data in a clear and thoughtful manner."
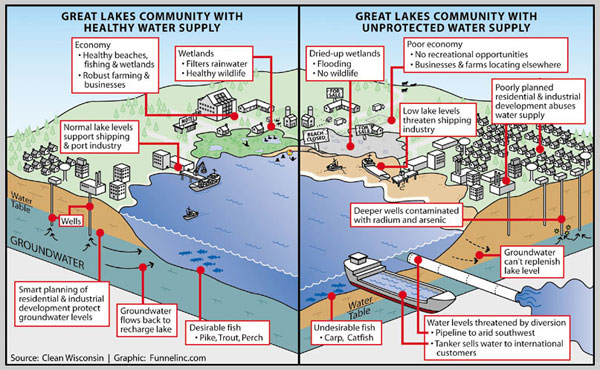
This fact-based approach appeals to an audience more apt to care for a cause it understands. Water conservation, for example, is easier to comprehend when various threats on the intricate groundwater process are visualized. Before and after images powerfully convey a problem or proposed solution.
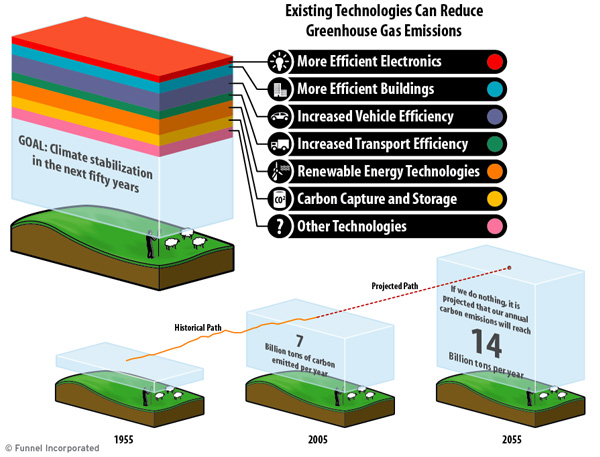
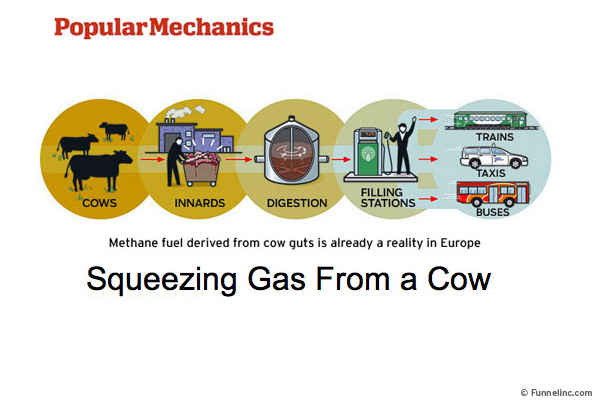
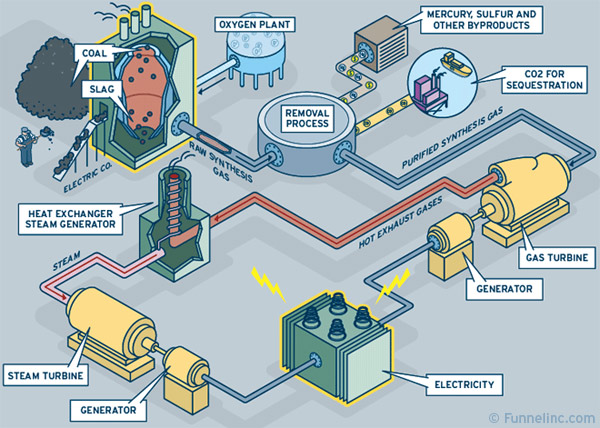
"We excel in taking a difficult scientific process and making it easier for people to understand through pictures and text," continues Wilson. "Breaking the process down into illustrated phases makes information less intimidating and more inviting."
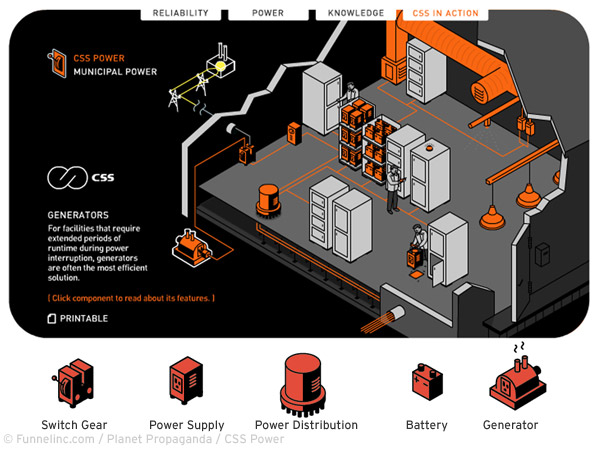
A growing trend is the creation of icons to represent an organization's earth-friendly mission or product that goes beyond the ubiquitous green leaf. A common visual language (CVL) serves as a visual shorthand keeping communication consistent and branded whether used in a presentation, as a product badge or as website information guideposts.
"Clients hire us to explore visual metaphors that articulate an organization’s environmental stewardship in a unique way," continues Wilson. "An added benefit is the universal appeal icons have to a variety of audiences, cultures and languages."
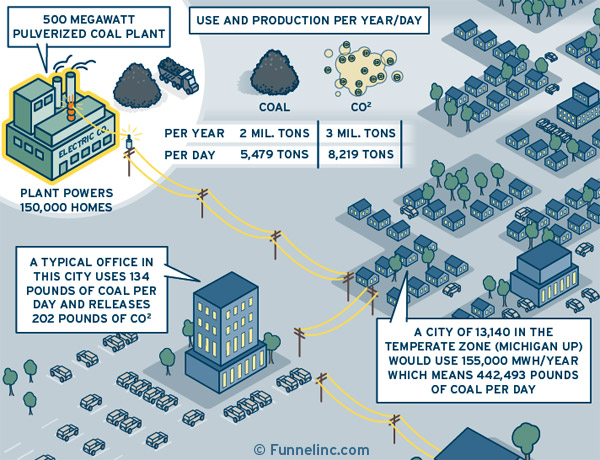
And as consumers hold organizations accountable for their actions, information design is a useful tool in the development of user-friendly charts and diagrams. Deliberate selection of a chart's format, colors and embellishments elevates data to enhance understanding and be more persuasive to inspire change.
ABOUT FUNNEL INCORPORATED: Funnel Incorporated (http://www.funnelinc.com) is an information design firm that specializes in making the complex clear through the creation of infographics, icons, charts, maps and instructions.
# # #
|